The Math Behind Predicting High-Scoring Football Matches
There are fundamentally two approaches to modeling


Two Ways to Model a Football Match
There are fundamentally two approaches to modeling football match outcomes. The first predicts the result directly, estimating whether a match ends in a win, draw, or loss through ordinal regression. The second models the exact score, estimating the probability of each possible number of goals scored by each team. For anyone serious about over 2.5 goals predictions, the second approach is where the real work happens, and where the mathematics gets genuinely interesting.
Football analytics platforms and resources covering football teams ranking at TipsGG can help users access structured information about team strength and performance. Behind the interface, the mechanics of mathematical football prediction are considerably more layered.
The Poisson Foundation
First developed in 1982, the double Poisson model assumes goals scored by each team are Poisson distributed with a mean depending on attacking and defensive strengths. That foundational structure has proved durable. A common version uses an attack coefficient and a defense coefficient to estimate expected goals for both the home and away team, then feeds those estimates into the distribution to generate scoreline probabilities.
From there, the math becomes useful for totals betting. The Poisson distribution calculates the likelihood of a team scoring a specific number of goals given their historical performance and that of their opponents. Sum the probabilities of all scorelines where combined goals exceed 2.5 and you have a model-derived probability for that market. The same logic applies to over 3.5, under 1.5, or any threshold a bettor cares about.
Poisson models also incorporate team rankings and match venues as factors, which refines the expected goals estimates meaningfully. Home advantage, for instance, is not decorative. Team strength, venue advantage, and other team-specific characteristics can all contribute to scoring probability, while accounting for team identity can uncover variation that generalized linear models alone may not capture.
When Standard Poisson Falls Short
The basic model has a known weakness. Many matches end with zero goals, and this excess of low-scoring outcomes creates dispersion problems. Zero-modified Poisson distributions and zero-inflated models were developed specifically to address over- or under-dispersion in goal counts, making them more reliable when filtering for fixtures likely to produce multiple goals.
One documented application of Poisson regression in a betting context: a strategy applied to the 2018-2019 Eredivisie season placed bets when model probabilities exceeded bookmakers' odds and returned a profit across that season. That is a single historical data point, not a guarantee of anything repeatable, but it demonstrates the basic value-betting logic: find divergence between your model's probability and the implied probability in the odds.
Logistic Regression and the Over/Under Market
Logistic regression takes a different angle. Rather than modeling goal counts explicitly, it predicts binary outcomes directly, including over/under 2.5 goals, using predictors such as recent form, team strength, home and away advantage, and player injuries and suspensions. The output is a probability for one side of the binary, which slots cleanly into a value-betting framework.
Football prediction models built on logistic regression are common precisely because the over/under market is binary and the predictor set is well-understood. The tradeoff is interpretability versus granularity: you get a clean probability for one threshold, not a full distribution of scorelines.
Expected Goals as an Intermediate Layer
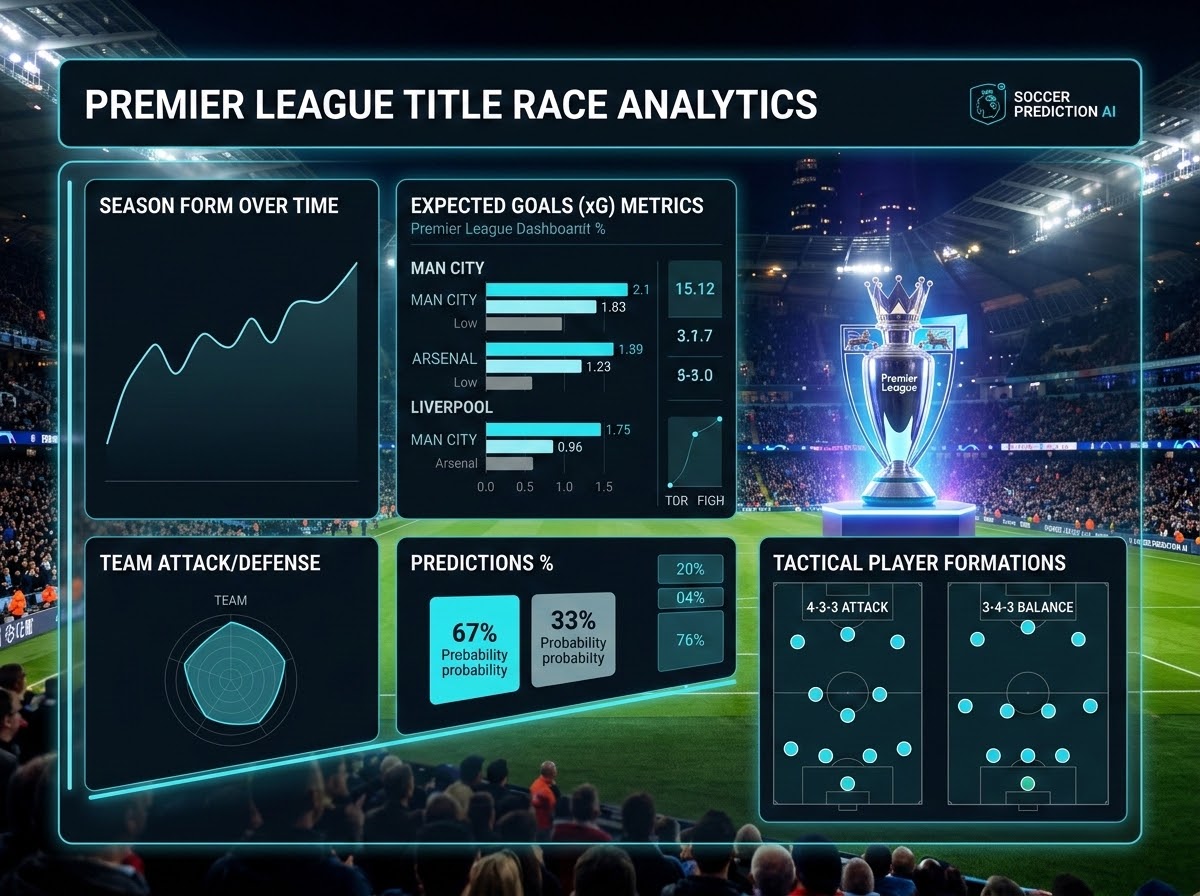
Expected Goals (xG) evaluates the quality of goal-scoring opportunities rather than counting actual goals. Teams with higher xG than their opponents tend to outperform over time, which makes xG a more stable signal than raw goal tallies. One approach combined xG with offensive and defensive ratings updated after each game to build both a classification model for match outcomes and a regression model for predicting scores. That layering, using xG to feed into a broader prediction architecture, reflects how practitioners think about over 2.5 predictions: the question is not just how many goals a team scores on average but how many quality chances they generate and allow.
Machine Learning Pipelines
Classical classification models applied to football prediction include Logistic Regression, Decision Trees, Random Forests, Support Vector Machines, Naïve Bayes, k-NN, and Bayesian Networks. More recently, ensemble methods like XGBoost and CatBoost have become widely used in high-performing approaches to mathematical football predictions.
A 2023 interpretable framework published in a peer-reviewed venue structured the problem across four stages: input feature embedding, non-rare match statistics selection, non-rare match statistics prediction, and match result forecasting. The first step used linear regression to predict shots and crosses from formations, players, and player qualities. Those predicted statistics were then concatenated with competition round data and fed into XGBoost for the final forecast. The explicit use of shots and crosses as intermediate predictions can be useful for anyone targeting high-scoring matches, since these metrics provide information about attacking activity and goal-scoring potential.
Evaluating Model Performance
One evaluation procedure uses a three-year historical training set and tests predictions against matches on the current date, computing the Ranked Probability Score to measure model accuracy. RPS penalizes confident wrong predictions more than cautious ones, which makes it a sensible metric for football prediction models where the goal is calibrated probability rather than binary accuracy.
The field of mathematical football predictions has moved well beyond simple win-draw-loss forecasting. The models feeding over 2.5 predictions today sit at the intersection of Poisson statistics, xG methodology, and gradient boosting, each layer adding signal that a single-equation approach cannot capture.