The Deception of the Table: How Advanced Metrics Uncover the League’s Ghost Overperformers
Football fans often treat the league standings as


Football fans often treat the league standings as an absolute truth. If a team sits in the top four after fifteen matches, the common consensus is that they are playing elite football. However, the scoreline frequently hides a messy reality. In many cases, the team in 8th place is actually more dangerous and technically proficient than the one fighting for a Champions League spot. To understand why, we have to look beyond the results and focus on the underlying process.
The traditional table is a record of history, not a prediction of the future. It counts points that have already been won, often through chaotic deflections, refereeing errors, or individual moments of brilliance that cannot be repeated weekly. Professional bettors and scouts use a different set of tools to identify "Ghost Overperformers." When analyzing team performance for potential outcomes, fans might look for a CaptainsBet Kenya login to check current odds, but the real value lies in understanding why those odds shift based on performance metrics rather than just past wins. Data allows us to see who is truly dominating the pitch and who is simply living on borrowed time.
The Science of Expected Goals (xG)
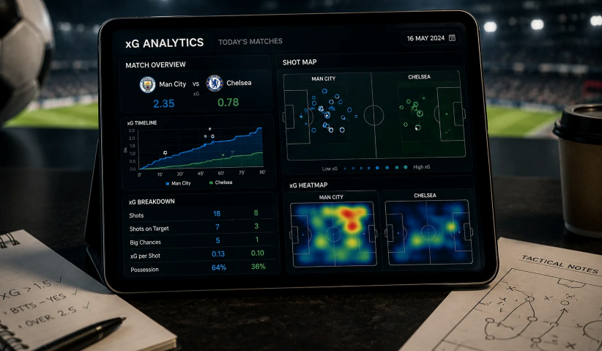
The most vital tool in this forensic analysis is Expected Goals (xG). Every shot is assigned a value between 0.01 and 0.99 based on historical data. A tap-in from three yards has a high xG, while a desperate strike from thirty yards has a very low one. By totaling these values, we get a clear picture of the quality of chances a team creates.
High-level analysis typically looks at these specific xG variations:
- Non-Penalty xG (npxG): This measures a team’s creativity in open play without the distorting effect of penalty kicks.
- xG Against (xGA): This reveals the true strength of a defense. A team might keep a clean sheet, but if their xGA was 2.5, it means their goalkeeper or the woodwork saved them from a blowout.
- xG Delta: The difference between actual goals scored and xG. A massive positive delta suggests a team is finishing at an unsustainable rate.
If a striker has scored ten goals from an xG of only three, he is "overperforming." While this looks great on a highlights reel, mathematics suggests he will eventually return to his mean. Unless that player is an elite finisher like Erling Haaland or Kylian Mbappé, those extra goals usually dry up by mid-season.
Understanding Expected Points (xPTS)
While xG analyzes shots, Expected Points (xPTS) analyzes entire matches. This metric uses simulations to determine the most likely result based on the xG of both teams. If Team A creates 2.8 xG and Team B creates 0.5 xG, Team A "deserved" the three points. If the game actually ended in a 0-0 draw, Team A still gains a high xPTS score for that match.
When we aggregate these scores into an alternative "Expected Table," the results are often shocking. You might find several patterns:
- The "Lucky" Contender: A team in 3rd place with an xPTS rank of 10th. They win games by one goal despite being outplayed.
- The "Unlucky" Underdog: A team in 14th place with an xPTS rank of 6th. They dominate possession and shots but suffer from poor finishing or defensive lapses.
- The Systemic Dominator: A team where the actual table and xPTS table align perfectly, showing a sustainable and robust tactical system.
Identifying the Collapse
Why does this matter? Because overperformance is almost always temporary. When a team sits high in the table despite poor metrics, they are "ghosts." They appear powerful, but they lack the structural foundation to stay there. This often happens when a goalkeeper is having a career-best month, stopping shots that should be goals. Eventually, the goalkeeper’s form dips, the lucky deflections stop going in, and the team plummet down the standings.
By watching the gap between xG and actual results, you can predict a team’s collapse weeks before it happens. True dominance is about winning the battle of the boxes consistently, not just finding a way to win when the metrics say you should have lost. The table might lie, but the data eventually tells the truth.